1. Is initial VET an attractive learning choice?
European education and training policy promotes initial vocational education and training (VET) as an attractive learning choice (2020 Osnabrück Declaration, 2020 Council Recommendation on VET). Participation in initial VET is a proxy of its attractiveness but does not always reflect individual preferences for general or vocational education.
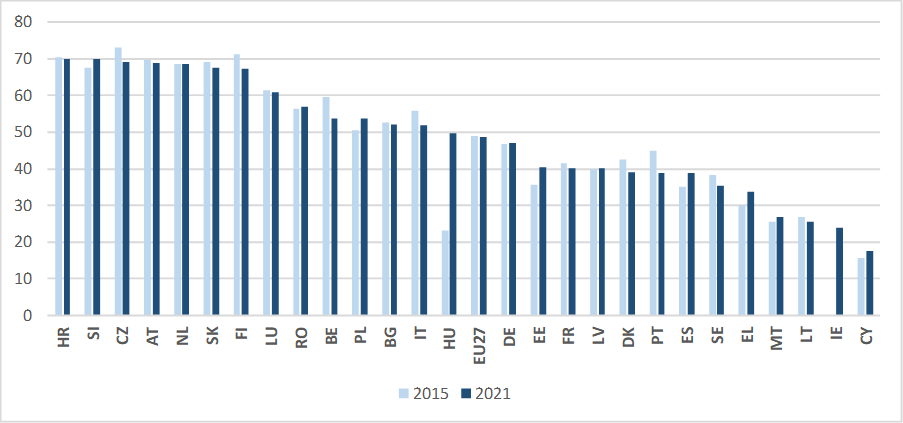
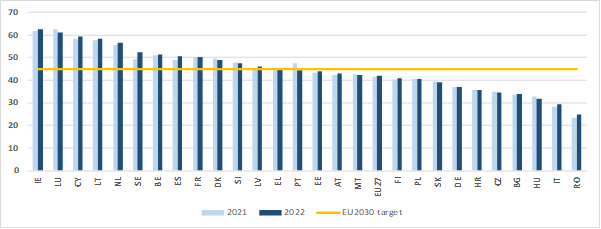
In 2021 in the EU, there were 8.8 million students in upper secondary (ISCED 3) VET programmes, almost half (48.7%) of all upper secondary students (Figure 1). Compared to 2015, this is a small drop of 0.2 percentage points, despite an increase of 0.1 million students.
Participation in initial VET varies widely across countries. In 2021, the share of upper secondary students enrolled in VET ranged from 70% in Croatia to 17.6% in Cyprus.
Figure 1. IVET students (as % of all upper secondary students) ISCED 3, 2015 and 2021
 Source: Cedefop calculations based on Eurostat data, UOE data collection on formal education.
2. Do women find initial VET an attractive learning choice?
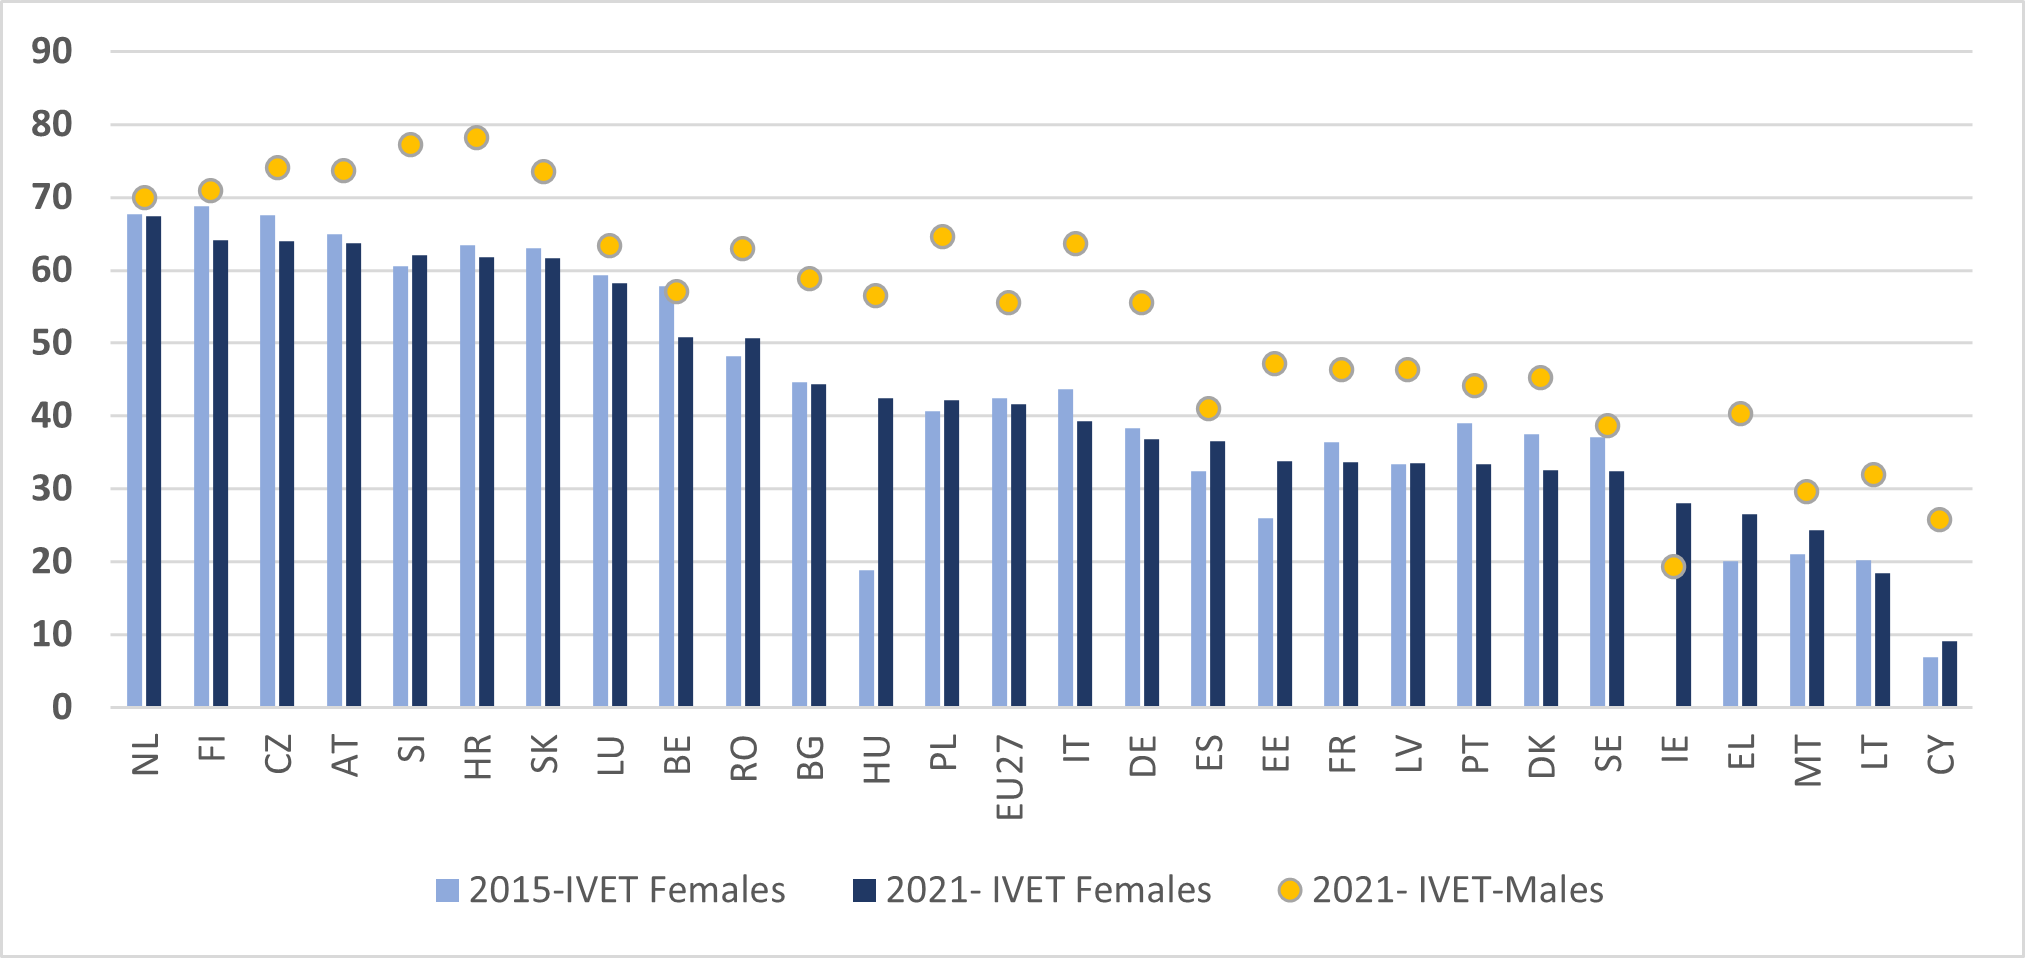
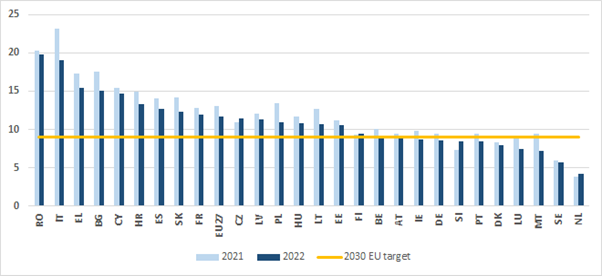
In 2021, 48.8% of all upper secondary students in the EU were enrolled in vocational programmes (Figure 2). However, initial VET participation among male students (55.5%) was significantly higher than among female students (41.6%).
Enrolment of female students in the vocational stream was more than 50% in ten Member States but below 30% in five. Enrolments in VET are higher for males than for females in all countries except Ireland. Differences by gender are biggest in Italy, Poland, Germany, Cyprus, Croatia and Slovenia (by 15 percentage points or higher) and narrowest in Malta, Spain and Luxembourg (five percentage points or smaller).
Figure 2. Female IVET students as % of all female upper secondary students, ISCED 3, 2015 and 2021
 Source: Cedefop calculations, based on Eurostat data, UOE data collection on formal education. 2015 data for Ireland are not available
3. Does initial VET provide opportunities for further learning?
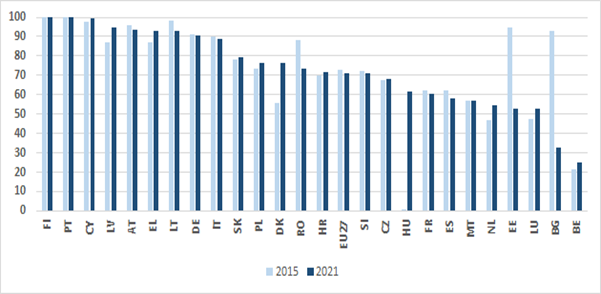
For VET to be attractive there should be flexible and permeable pathways between initial and continuing VET, general and higher education (2020 Council Recommendation on VET). In the EU in 2021, 71.1% of students in upper secondary VET were enrolled in programmes giving direct access to tertiary education (Figure 3).
Figure 3. IVET students in programmes with direct access to tertiary education (as % of all upper secondary IVET), ISCED 3, 2015 and 2021
 Source: Cedefop calculations based on Eurostat data, UOE data collection on formal education. NB: data are not available for Ireland and Sweden.
This share stood at or near to 100% in Finland, Portugal and Cyprus. Only in Belgium (25.2%) and Bulgaria (32.8%) is the share less than 50%. Compared to 2015, the EU average share dropped slightly by 1.6 percentage points but remained over 70%.
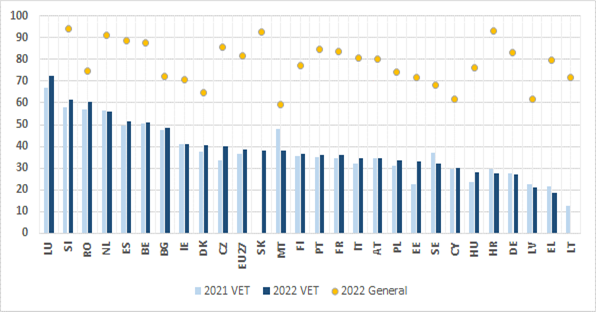
In 2022, 38.4% of graduates aged 18 to 24 and holding a medium level vocational qualification as their highest, said that they had participated in further education and training in the four weeks prior to the measurement by the EU Labour Force Survey (LFS). In some countries, such as Belgium, Luxembourg, Netherlands, Romania and Slovenia, this share is above 50%. Participation in further education and training is typically lower for young graduates with a medium level vocational qualification than for their counterparts from the general stream of education. However, that some 40% of VET graduates in the EU go on to further studies shows that VET provides opportunities for further learning.
Figure 3A. Young IVET graduates in further education and training (%), 2021-2022
 Source: Cedefop calculations based on Eurostat data, EU LFS, data supplied at Cedefop request. NB Slovakia, 2021 data for VET are not shown due to break in time series; Lithuania, 2022 data for VET are not sufficiently reliable due to small sample sizes); Luxembourg, 2022 data for general education are not available.
4. Is initial VET international?
The 2020 Council Recommendation on VET promotes international mobility for learning in VET. The EU has set a quantitative objective of 8% of learners in VET benefiting from international mobility as part of their VET studies by 2025. In 2021, in the EU overall, 2.1% of initial VET learners (at ISCED levels 3 and 4) experienced a learning period of at least 10 days in a calendar year in another country (Figure 4). This compares to 1.2% in 2020. In countries such as Latvia, Lithuania and Cyprus, learning mobility already exceeds the EU’s target of 8% by 2025.
Figure 4. IVET learners who benefitted from learning mobility abroad (%). ISCED levels 3-4, 2020 and 2021
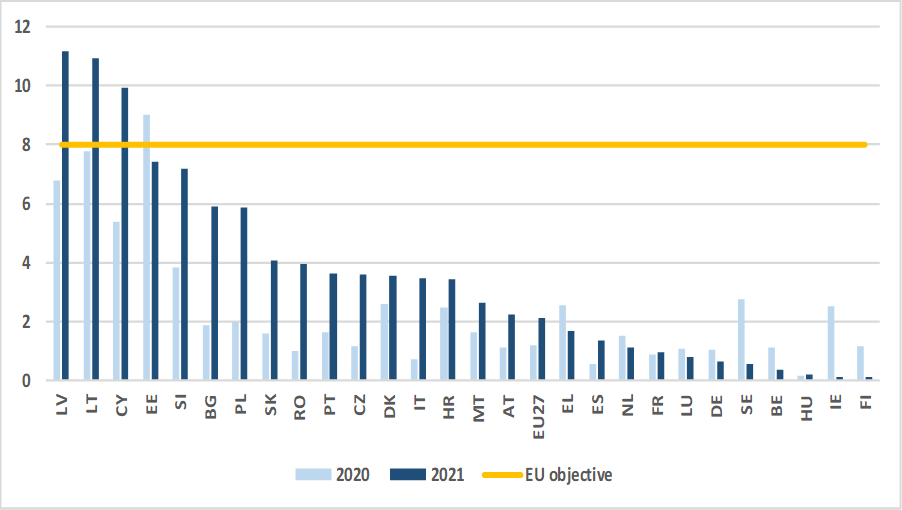 Source: Cedefop calculations based on European Commission methodology and specifications, European Commission Erasmus+ data supplied at Cedefop request as well as Eurostat data , UOE data collection on formal education. NB: The number of mobile VET learners is expressed per 100 initial VET graduates at the same ISCED levels. Data are provisional estimates and are affected by the impact of the COVID-19 pandemic.
Learning and knowledge of foreign languages helps make initial VET more international. In the EU, in 2021, estimates are that 1.2 foreign languages are learned, on average, in upper secondary VET (Figure 4A). This is below the average of 1.6 calculated for upper secondary general education. The average number of foreign languages learned by upper secondary VET students is highest in Luxembourg, Romania, Poland, Finland, Bulgaria and Italy (at or above 1.5).
Figure 4A. Average number of foreign languages learned in IVET- ISCED 3, 2015 and 2021
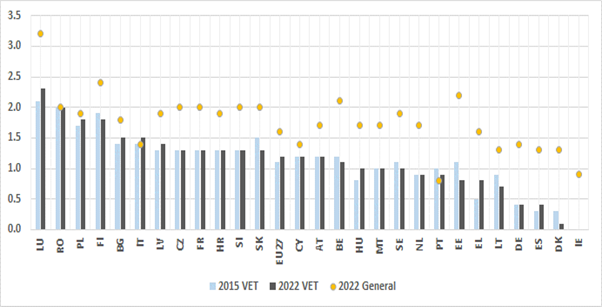 Source: Eurostat, UOE data collection on formal education. EU averages are Cedefop estimates based on available country data. NB. Ireland (data on VET are not available).
5. Does initial VET provide learning at and experience of the workplace?
Work-based learning can provide a bridge to the labour market as Cedefop research shows. In the 2010-20 European VET policy cycle, the Bruges communiqué and the Riga conclusions called for work-based learning to become a key feature of initial VET systems.
The 2020 Council Recommendation on VET and the 2021 Council Resolution on the European Education Area continue to emphasise the importance of work-based learning in VET. They set a target for the EU overall that, by 2025, 60% of recent graduates from VET aged 20 to 34, who obtained a VET qualification at ISCED level 3-4 as their highest in the last three years, should have experienced a (cumulative) period of at least one month of work-based learning as part of their VET studies.
In 2022, the share of recent VET graduates having experienced work-based learning was estimated at 60.1%. This was slightly down from 60.6% in 2021 but still indicates that the 2025 EU target is already met (Figure 5). However, big differences between countries persist, ranging from 8.4% of recent VET graduates having work experience in their VET studies in Romania, to 98.4% in Spain.
Figure 5. Recent IVET graduates (20-34-year-olds) with work-based learning experience as part of their vocational education and training (%), 2021 and 2022
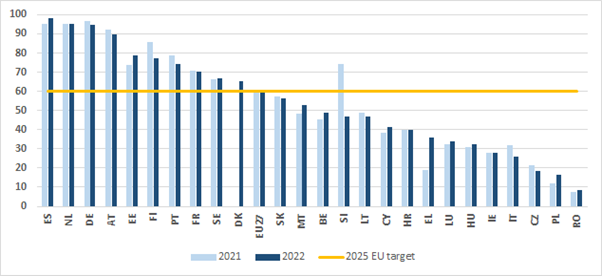 Source: Eurostat, EU LFS. The indicator covers graduates who obtained a VET qualification as their highest at ISCED level3-4 in the last 3 years. NB : 2021 and 2022 data for Bulgaria and Latvia as well as 2021 data for Denmark are not sufficiently reliable to be published due to small sample sizes. 2021 and 2022 data for Cyprus, Germany and Ireland as well as 2021 data for Hungary should be interpret with caution as they are affected by some reliability issues.
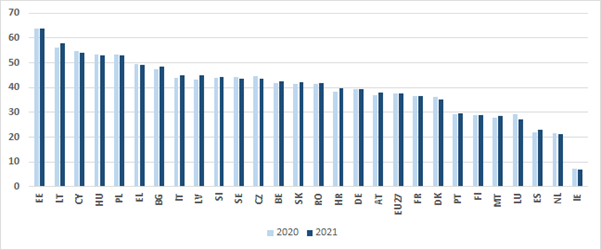
In 2021, in the EU overall, it is estimated that 29.3% of upper secondary VET students were enrolled in combined work- and school-based programmes (Figure 5A). A vocational programme is classified as work-based if between 25% and 90% of the curriculum is outside the school environment. This definition includes apprenticeships.
Figure 5A. IVET work-based students as % of all upper secondary IVET, ISCED 3, 2015 and 2021
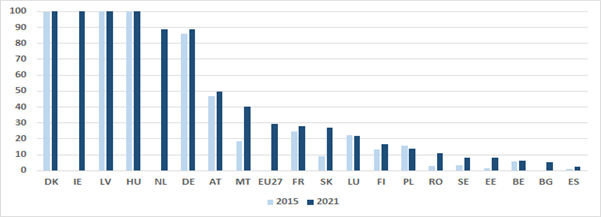 Source: Cedefop calculations, based on Eurostat data, UOE data collection on formal education. EU averages are Cedefop estimations based on available country data. NB. 2015 data for the Netherlands and the EU are not presented due to break in time series. Data for the Netherlands only cover the public sector of upper secondary VET. The distinction between combined work-based and school-based and school-based vocational programmes is not applicable for statistical purposes in Member States not displayed in the chart
6. Which skills does initial VET bring to the labour market?
In 2021, 2.2 million students graduated from upper secondary vocational educational in the EU, about half of all upper secondary graduates. (47.9%). This is largely in line with line with enrolments patterns at the same ISCED level (48.7%) and reassures that overall there are no major differences between enrolments and graduation patterns in VET (as percentages of the corresponding totals).
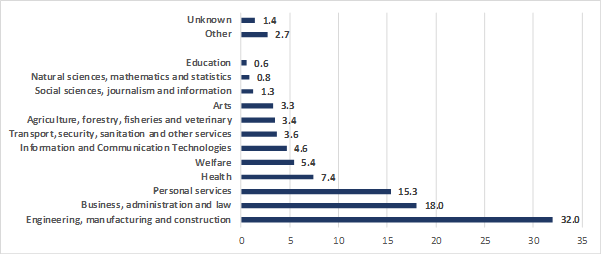
Looking at the studies followed by initial VET graduates gives insights into the skills they bring into the labour market. In the EU, in 2021, about 32% of all upper secondary initial VET graduates obtained qualifications in subjects related to engineering, manufacturing and construction (Figure 6).
Some 18% graduated in business, administration and broad law-related studies, while around 15.3% graduated in personal services (including domestic services, hair and beauty services, hotel, restaurants, catering, sports, travel, and tourism and leisure).
In 2021 only 4.6% of upper secondary VET students graduated in information and communication technology.
Figure 6. IVET graduates by field of study (% of all upper secondary IVET graduates), ISCED 3, EU27, 2021
 Source: Cedefop calculations based on Eurostat data, UOE data collection on education systems, Statistics are based on the 2013 ISCED F classification of field of study, Results present a combination of broad and narrow fields of study. NB Arts include audio-visual and media production, fashion, interior and industrial design, fine arts, handicraft, music and performing arts. Personal services include domestic services, hair and beauty services, hotel, restaurants, catering, sports, travel, tourism, and leisure services as well as other personal services. The category transport, security, community sanitation, hygiene and occupational health and safety services is considered apart. The category “Other in the chart” includes languages and other humanities relevant for VET.
Around 38% of initial VET students in the EU, graduated in STEM (science, technology, engineering and maths) related subjects (Figure 6A). In countries such as Estonia, Lithuania Cyprus, Hungary and Poland the share of upper secondary VET graduates in STEM subjects was above 50%. In others, such as Ireland, the Netherlands and Spain it was below 25%.
Figure 6A. STEM graduates from upper secondary IVET (% of total), 2020 and 2021
 Source: Cedefop calculations based on Eurostat data, UOE data collection on formal education. The chart is based on the 2013 ISCED-F classification of fields of study. For the indicator displayed, Stem subjects are considered to be those related to Natural Sciences, mathematics, statistics, Information and Communication technology, engineering, manufacturing and construction.
7. How many initial VET graduates are employed?
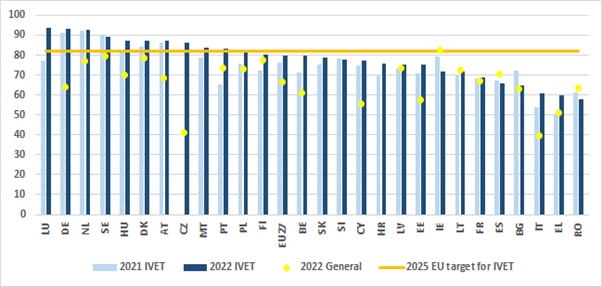
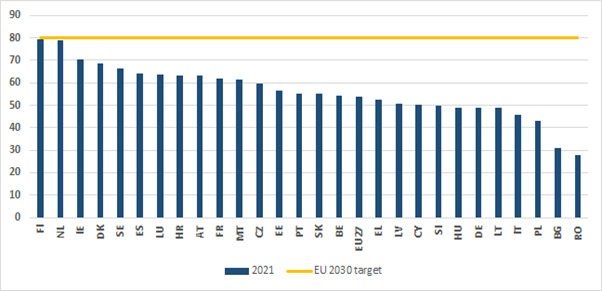
In the EU in 2022, the employment rate for recent VET graduates was 79.7% (Figure 7), below the target of at least 82% by 2025 set by the 2020 Council Recommendation on VET. Between 2021 and 2022, the average employment rates of initial VET graduates went up in the EU overall by 3.5 percentage points.
Recent VET graduates are defined as young people aged 20 to 34, no longer in education and training, and who obtained a vocational qualification at ISCED level 3-4 as their highest educational attainment in the previous one to three years.
Employment rates of recent VET graduates vary across Member States. The employment rate of young VET graduates is already above the EU’s 2025 target of 82% in Luxembourg, Germany, the Netherlands, Sweden, Hungary, Denmark, Austria, Czechia, Malta, Portugal and Poland. Employment rates of recent VET graduates are about or below 60% in Italy, Greece and Romania.
Employment rates of young VET graduates can be compared with similarly defined graduates from general education. In 2022, in the EU, at 79.3% the employment rate for recent VET graduates was 13.3 percentage points higher than that for general education graduates. Differences between employment rates for recent VET and general education graduates are smallest in Finland, France, Latvia and Bulgaria (below 3 percentage points). In Ireland, employment rates for general education graduates are higher.
Figure 7. Recent IVET graduates (20-34-year-olds) in employment (%), 2021 and 2022
 Source: Eurostat, EU LFS. NB : the indicator covers graduates at ISCED level 3-4 and no longer in education and training. 2021 data on VET for Czechia cannot be compared over time due to break in time series and are not displayed. 2021 and 2022 data on VET for Malta, Slovenia Latvia and Bulgaria, should be interpreted with caution as they are affected by some reliability issues, as well as 2022. data on general education for Czechia, Greece and Romania. In Luxembourg, Malta, Slovakia and Slovenia data for general education are not sufficiently reliable to be published due to small sample sizes. In Spain and France data not yet reflect the new EU LFS definition of employment.
8. Is the educational attainment level of young people continuing to rise?
Raising the educational attainment of young people is a major objective of European education and training policy. The EU aims to achieve this in two main ways. First, by lowering the EU average share of early leavers from education and training. Second, by increasing the share of the young population with a qualification at tertiary level of education.
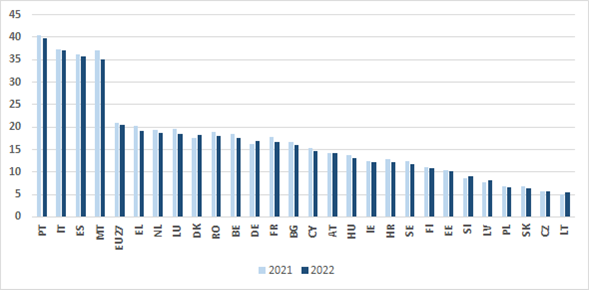
In 2010, the EU set a target of reducing early school leaving to below 10% by 2020. The EU met this target and early school leaving stood at 9.9% in 2020. Reducing early leaving remains a priority and the 2021 Council Resolution on the European Education Area set a new target to reduce it to less than 9%, by 2030. In 2022, the rate of early school leaving was 9.6% (Figure 8). Early school leaving is estimated at around 11% in countries such as Romania, Spain, Hungary, Germany, Italy, and below 5% in Lithuania, Poland, Greece, Slovenia, Ireland and Croatia.
Figure 8. Early leavers from education and training (%), 2021 and 2022
 Source: Eurostat, EU LFS.NB: data for Croatia (2021 and 2022) and for Slovenia (2021) should be interpreted with caution as they are affected by some reliability issues.
Raising tertiary level educational attainment among young people is expected to help meet demand for a highly qualified work force and reduce the risk of unemployment. The indicator is defined as the percentage of the young population who have successfully completed tertiary level education.
Tertiary level qualifications are defined as those classified to ISCED 5-8. In 2010, the EU set a target of at least 40% of 30–34-year-olds having a tertiary level qualification by 2020. The EU reached 41.1 % in that year. The 2021 Council Resolution on the European Education Area set a new target of 45% by 2030 for the wider age group of 25-34-year-olds. In 2022, the new indicator estimated an EU average of about 42% of 25–34-year-olds with a tertiary level qualification (Figure 8A). Estimates are that several Member States already exceed the 2030 target.
Figure 8A. 25–34-year-olds with tertiary attainment (%), 2021 and 2022
 Source: Eurostat, EU LFS. NB: the indicator is defined and those aged 25 to 34 years who have successfully completed tertiary level education (ISCED 5-8).
9. Are Europe’s young people guaranteed employment, education or training?
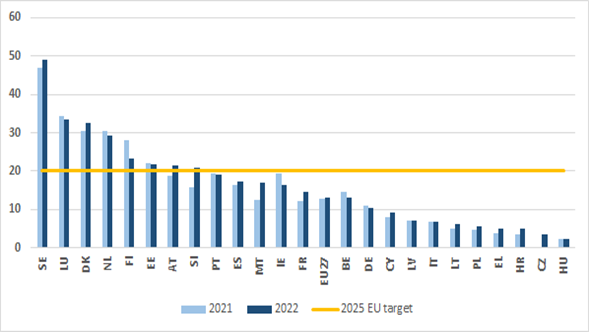
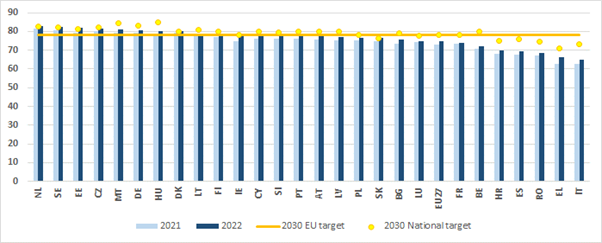
Reducing the share of young people not in employment, education or training (NEETs) is a goal of the EU Youth guarantee and the Reinforced Youth Guarantee. The 2021 European Pillar of Social Rights Action Plan has set a target to reduce the share of NEETs aged 15 to 29 years old to 9%, in the EU overall, by 2030. In 2022 the EU average was 11.7%, compared to 13.1% in 2021 (Figure 9).
Figure 9. NEET rate for 15–29-year-olds (%), 2021 and 2022
 Source: Eurostat, EU LFS. In Spain and France data not yet reflect the new EU LFS definition of employment. 2022 data for Czechia are not comparable with 2021 due to break in time series.
In 2022, countries with the highest NEET rates were Romania and Italy (at or above 19%), while those with lowest were Sweden and the Netherlands (below 6%). Other countries, such as Ireland, Germany, Slovenia. Portugal, Denmark and Luxembourg were also below 9% in 2022.
10. Is lifelong learning a reality for adults?
Raising participation in adult learning was a key objective of the EU Education and training 2020 strategy, and continues to be a priority in the post-2020 European VET policy cycle.
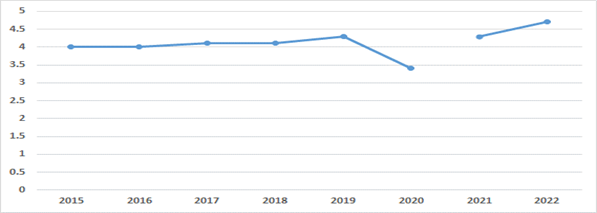
The EU target for 2020 was an average of at least 15% of adults (25 to 64 years old), in the EU, participating in formal or non-formal education and training. During the 2010-20 European VET policy cycle, participation in lifelong learning was counted if the learning had taken place four weeks prior to the measurement by the EU Labour Force Survey (LFS).
Participation measured this way did not increase much and the 2020 objective was not met. In 2019 the indicator peaked at 10.8%, before dropping to 9.1% in 2020, which may have been due to the COVID-19 pandemic. In 2022, measured in this way, adult participation in lifelong learning stood at 11.9% in the EU overall (Figure 10).
Figure 10. Adults (25–64-year-olds) with a learning experience in the last 4 weeks (%), EU 2015-22
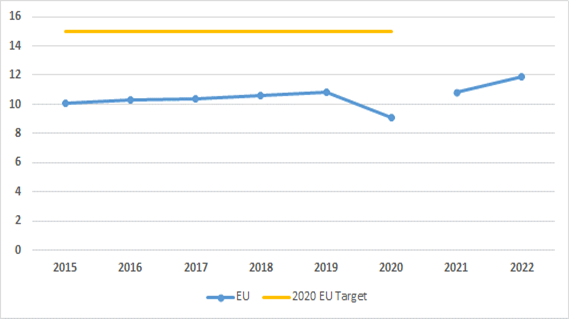 Source: Eurostat, EU LFS. NB Due to break in time series. data for 2021 and 2022 are not comparable with those for previous years.
In the post-2020 European VET policy cycle, a new method of measuring adult participation in lifelong learning was adopted. The new indicator counts adult participation in lifelong learning if the learning took place in the 12 months, rather than four weeks, prior to measurement. Based on this method, the EU has set new targets. The 2021 Council Resolution on the European Education Area has set a target of 47% of adults participating in lifelong learning by 2025, while the 2021 European Pillar of Social Rights Action Plan has set a target of 60% by 2030.
In 2016 in the EU, 37.4% of adults (aged 25 to 64) participated in formal or non-formal education and training in the 12 months prior to measurement, according to the Adult Education Survey (AES) (Figure 10A). This went slightly up to 39.5% in 2022. The AES is used as a proxy until new data, collected through a revised LFS, becomes available.
Figure 10A. Adults (25–64-year-olds) with a learning experience in the last 12 months (%), 2016 and 2022
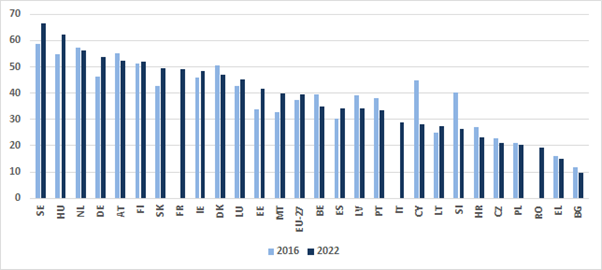 Source: Eurostat, AES, data supplied at Cedefop request and excluding participation in guided on the job training as per expected EU LFS standards; Cedefop uses this source as a proxy up until relevant LFS data become available. 2016 data for France and Italy and Romania are not comparable with those for 2022 and are not displayed.
11. Is lifelong learning a reality for adults with low levels of education?
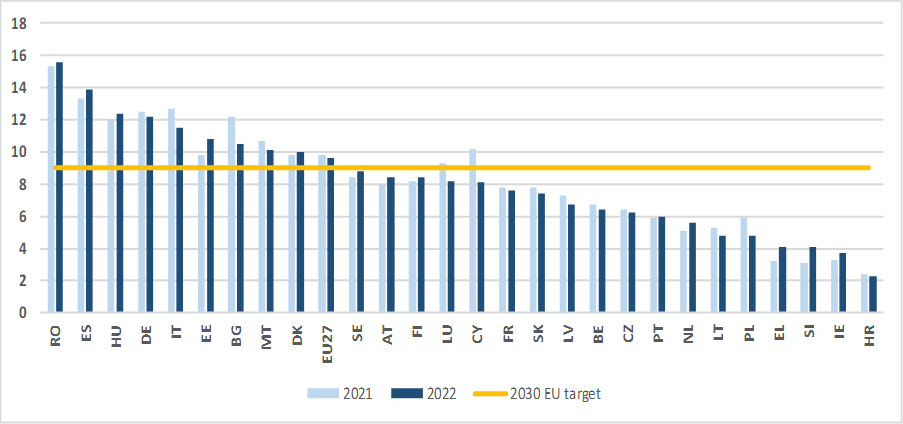
On the previous measure, (adults who took part in education and training in the four weeks prior to measurement by the LFS), participation in lifelong learning by low qualified adults peaked at 4.3 % in 2019 before dropping to 3.4% in 2020, which may have been due to the Covid-19 pandemic (Figure 11). In 2022, the figure rose to 4.7 % in the EU overall.
Figure 11. Low-qualified adults with a learning experience in the last 4 weeks (%), EU, 2015-22
 Source: Eurostat, EU LFS. NB Due to break in time series. data for 2021 and 2022 are not comparable with those for previous years
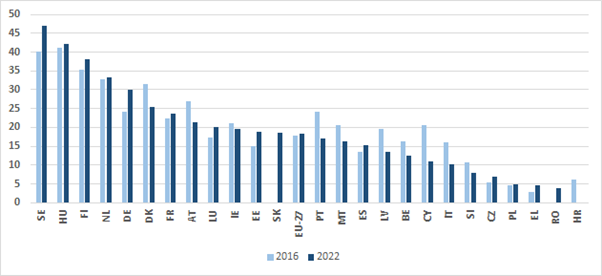
Using the new method of measuring adult participation in lifelong learning (adults who took part in education and training in the 12 months, rather than four weeks prior to measurement) and using the latest AES data, it is estimated that in the EU in 2016, 17.9% of low qualified adults participated in lifelong learning; the estimate went up to 18.4% in 2022 (Figure 11A). The 2020 European skills agenda has set a target to raise the level of participation to 30% by 2025.
Figure 11A. Low-qualified adults with a learning experience in the last 12 months (%), 2016
 Source: Eurostat, AES, data supplied at Cedefop request and excluding participation in guided on the job training as per expected LFS standards; Cedefop uses this source as a proxy up until relevant LFS data become available. 2016 and 2022 Data are not sufficiently reliable to be published for Bulgaria and Lithuania, as well as 2016 data for Romania and Slovakia.. Data for Denmark, Slovakia, Latvia, Greece, and Czechia should be interpreted with caution due to some reliability issues.
12. Is lifelong learning a reality for unemployed adults?
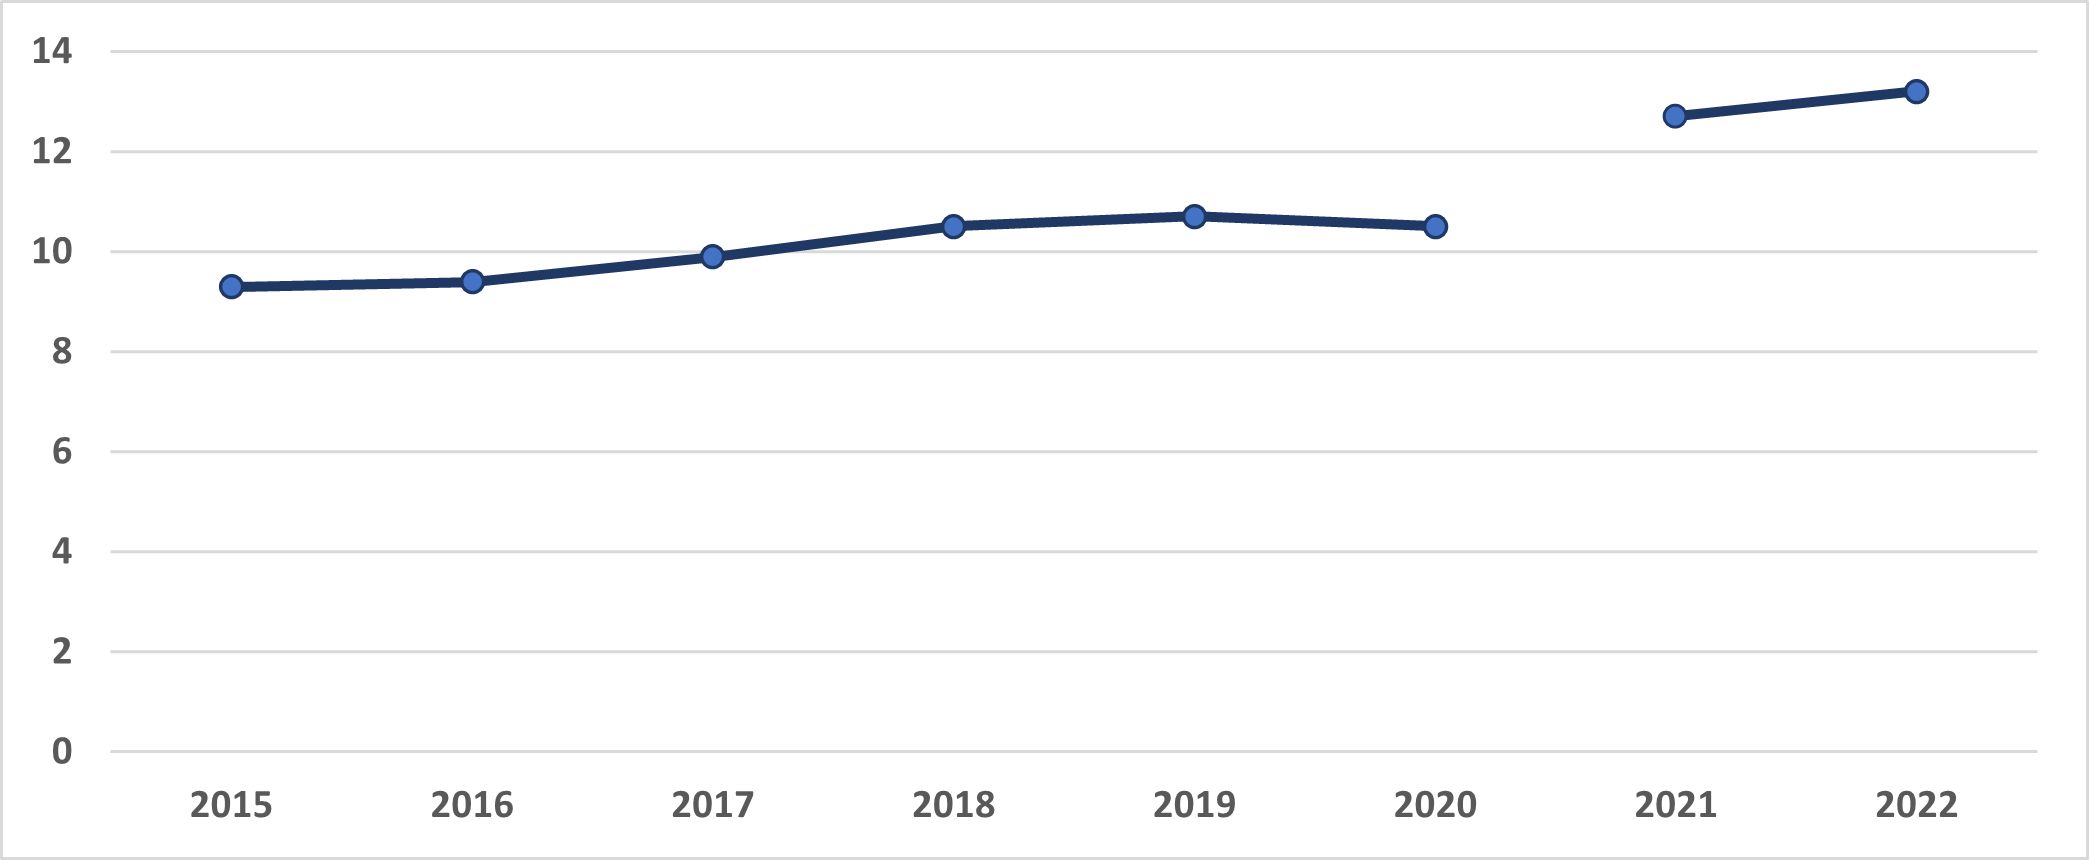
Participation in education and training by unemployed adults has been monitored for many years. Taking the 2010-20 European VET policy cycle definition of counting participation in lifelong learning if the learning had taken place four weeks prior to the measurement by the EU LFS, participation by unemployed adults in lifelong learning rose from 9.3% in 2015 to 13.2% in 2022 (Figure 12). For the new post-2020 VET policy cycle. The 2020 European skills agenda has set a target to raise the share of unemployed adults agreed 25 to 64 with a recent learning experience to 20% by 2025.
Figure 12. Unemployed adults with a learning experience in the last 4 weeks (%). EU, 2015-22
 Source: Eurostat, EU LFS. NB Due to break in time series. data for 2021 and 2022 are not comparable with those for previous years.
At country level, in 2022 the highest share of unemployed adults in formal or non-formal learning was estimated for Sweden (49%). At the other end of the range, many EU countries have below 10% of unemployed adults participating in lifelong learning (Figure 12). However due to small sample sizes, data should be interpreted with caution.
Figure 12A. Unemployed adults with a learning experience in the last 4 weeks (%). EU, 2021 and 2022
 Source: Eurostat, EU LFS. NB data for Bulgaria, Romania and Slovakia are not sufficiently reliable to be published due to small sample sizes. Data for Luxembourg, Malta, Hungary, Croatia should be interpreted with caution as they are affected by some reliability issues. 2021 data for Czechia are not comparable over time and therefore are not displayed.
13. Do enough people have digital skills?
Digital skills are a precondition for participation in the labour market and society. In 2021, the EU average share of adults aged 16 to 74 with at least basic digital skills was estimated at 53.9% (Figure 13).
At country level the share is highest in Finland and the Netherlands at about 79%. In Bulgaria and Romania less than one in three adults have at least basic digital skills.
The EU has set a target in the 2020 European skills agenda of at least 70% of those aged 16 to 74 having basic digital skills by 2025, in the EU overall. According to the 2021 European Pillar of Social Rights Action Plan, this should rise to at least 80% by 2030.
Figure 13. Adults (16–74-year-olds) with at least basic digital skills (%), 2021
 Source: Eurostat, EU Community survey on ICT usage in households and by individuals
14. How many adults have low levels of education?
Educational attainment can influence employment prospects and wage levels. In the EU in 2022, 20.5% of adults were low qualified (aged 25 to 64 with an educational attainment level of ISCED 0-2), compared to 20.9% in 2021 (Figure 14). In 2022, the highest shares of low educated adults were in Portugal, Italy, Spain and Malta (all above 33%). The lowest shares were in Slovenia, Latvia, Poland, Slovakia, Czechia and Lithuania (all below 10%).
Figure 14. Adults with lower level of educational attainment (%), 2021 and 2022
 Source: Eurostat, EU LFS
15. How many adults are employed?
Raising the EU employment rate to at least 75% was a target of the Europe 2020 strategy. The EU fell short of its target. The employment rate for 20-64-year-olds peaked at 72.7% in 2019, dropping to 71.7% in 2020, which may have been due to the COVID-19 pandemic.
The 2021 European Pillar of Social Rights Action Plan sets a new target of 78% for the employment rate of 20-64-year-olds, by 2030. In the EU overall, the employment rate was 74.6% in 2022 (Figure 15). Compared to 2021, in 2022 the employment rate of 20-64-year-olds was higher in all Member States.
Figure 15. Employment rate for 20–64-year-olds (%), 2021 and 2022
 Source: Eurostat, EU LFS. Adjusted break free time series for main indicators. In Spain and France data not yet reflect the new EU LFS definition of employment